
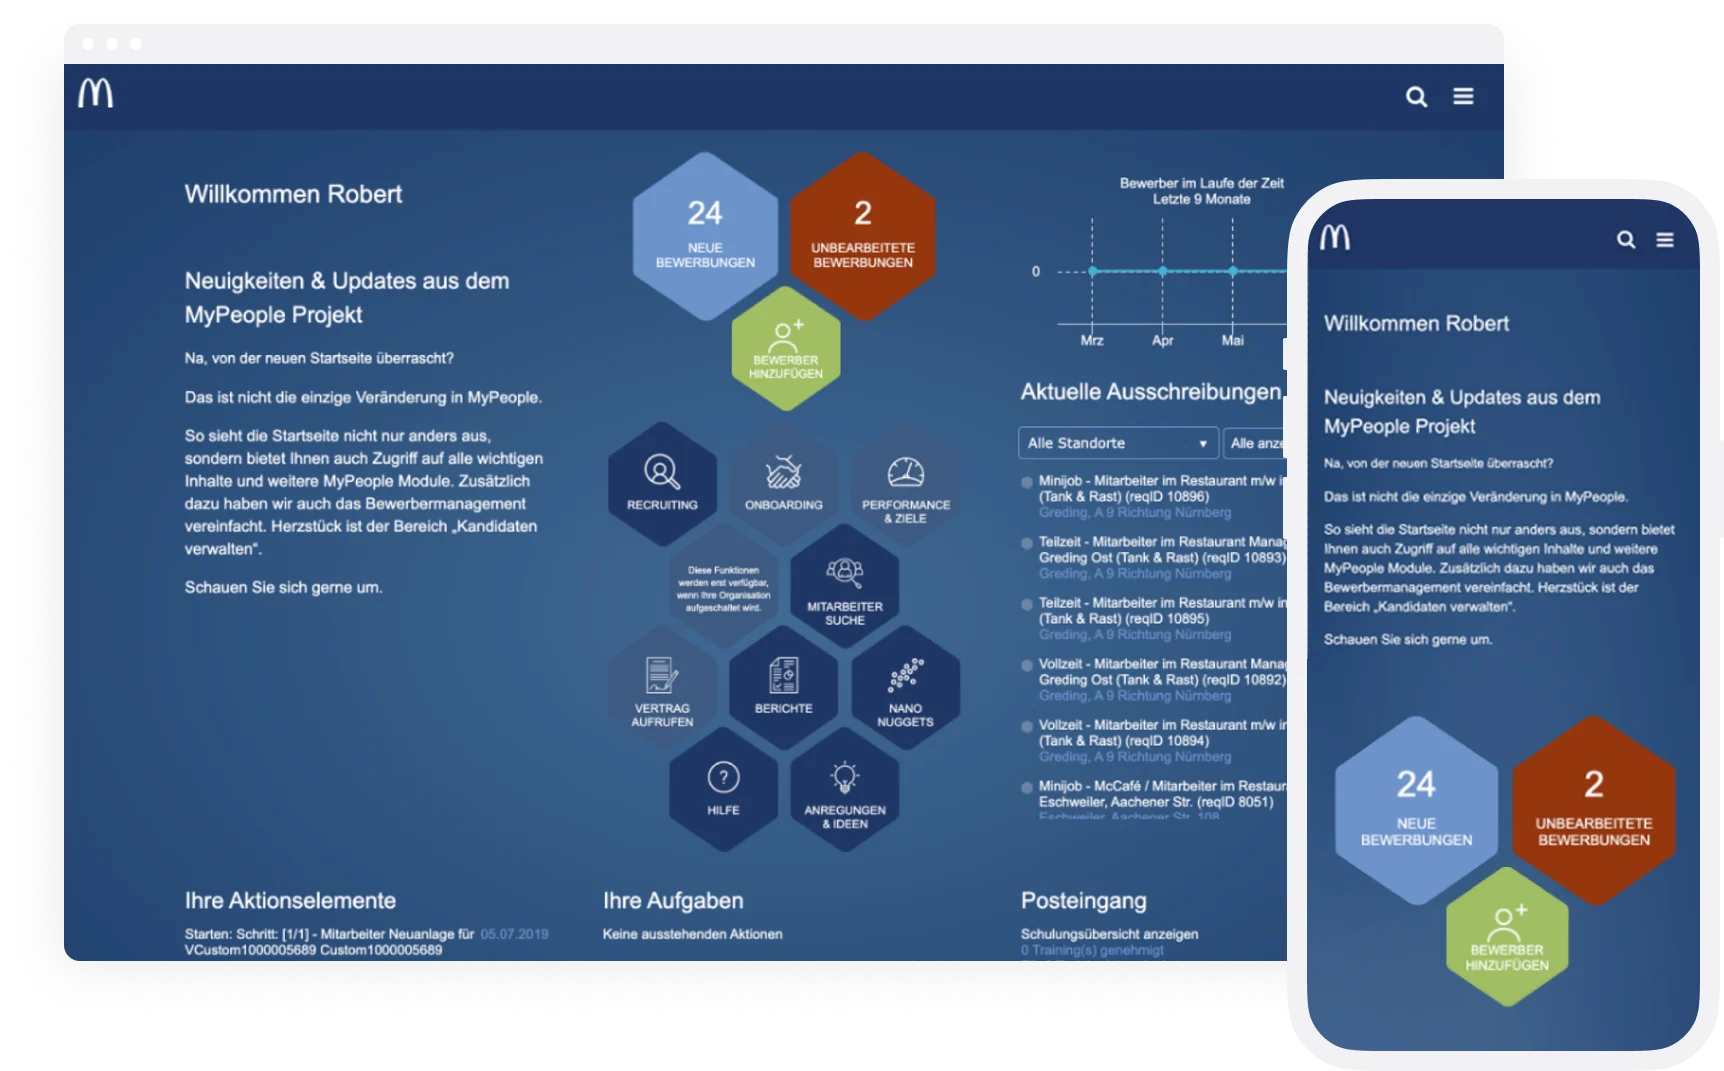
HR Analytics & Reporting to understand and act on your data
Get a clear view of your platform and know exactly where to step in. Build HR dashboards and reporting tools, track key metrics, and turn reporting into clear, actionable insights that support better decisions across HR, learning, and your teams.
 Listen to the summary0:00 / 1:09
“Data tells a story. I help you build the dashboards and visual reports that turn raw numbers into insights your HR team can act on.”
Predict and act on what's happening
Understand the story of your data
Most platforms already have the data you need. The real value comes from connecting it, making it easy to understand, and turning it into insights your teams can use to make better decisions.
Connect all your data
Bring it into one clear view across systems, teams, and metrics
Focus on key metrics
Track what drives performance, learning, and engagement
Spot trends early
Identify patterns and changes before they become bigger challenges
Role-specific insights
Give HR and managers the data they need for their day-to-day decisions
Move from reports to decisions
Use your data to guide what happens next

Numbers don’t speak for themselves
Make your data tell a story that drives decisions
Most teams already have the data. The challenge is making it meaningful.
Dashboards and reports don’t drive decisions on their own. They only work when people understand what they’re looking at and what it means for them.
Good data storytelling turns information into action. If people don’t understand the story, they won’t act on it.
Make data your strongest argument
Put your data to work across your teams
Data becomes valuable when people can actually use it. Give your teams access to the right dashboards and reporting tools, in the right format, so they can understand what’s changing and respond at the right moment.
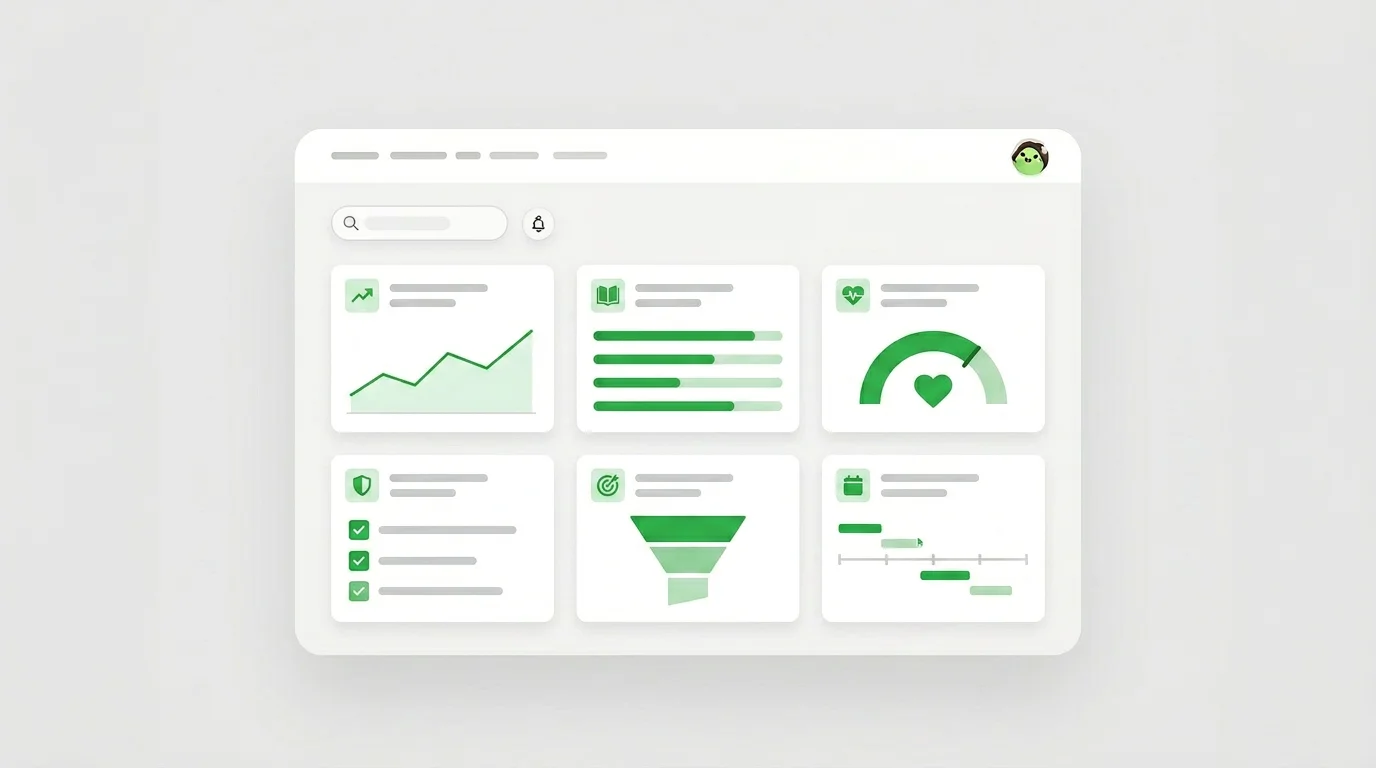
Get the full picture
Dashboards that keep you on track
Bring your data into one place so it answers real questions, not just shows numbers. See what’s driving results and where to intervene.
Real-time dashboards
Stay up to date with live data across your platform
Custom views
Focus on the metrics that matter to your team
Drill-down insights
Explore data in more detail when you need to
Bring clarity to complex data
Move beyond static reports with interactive insights
Data shouldn’t sit in static reports. It should help you explore what’s happening, spot changes, and explain results clearly to others.
Clear visualizations
See patterns, trends, and changes at a glance
Structured views
Organize data so it’s easy to read and explain
Interactive exploration
Filter, adjust, and explore your data from different angles
Data that drives behavior
Make progress visible and motivating
Data doesn’t have to feel like reporting. When progress is visible, it becomes something people follow, react to, and improve on. That’s when data starts to drive real engagement.
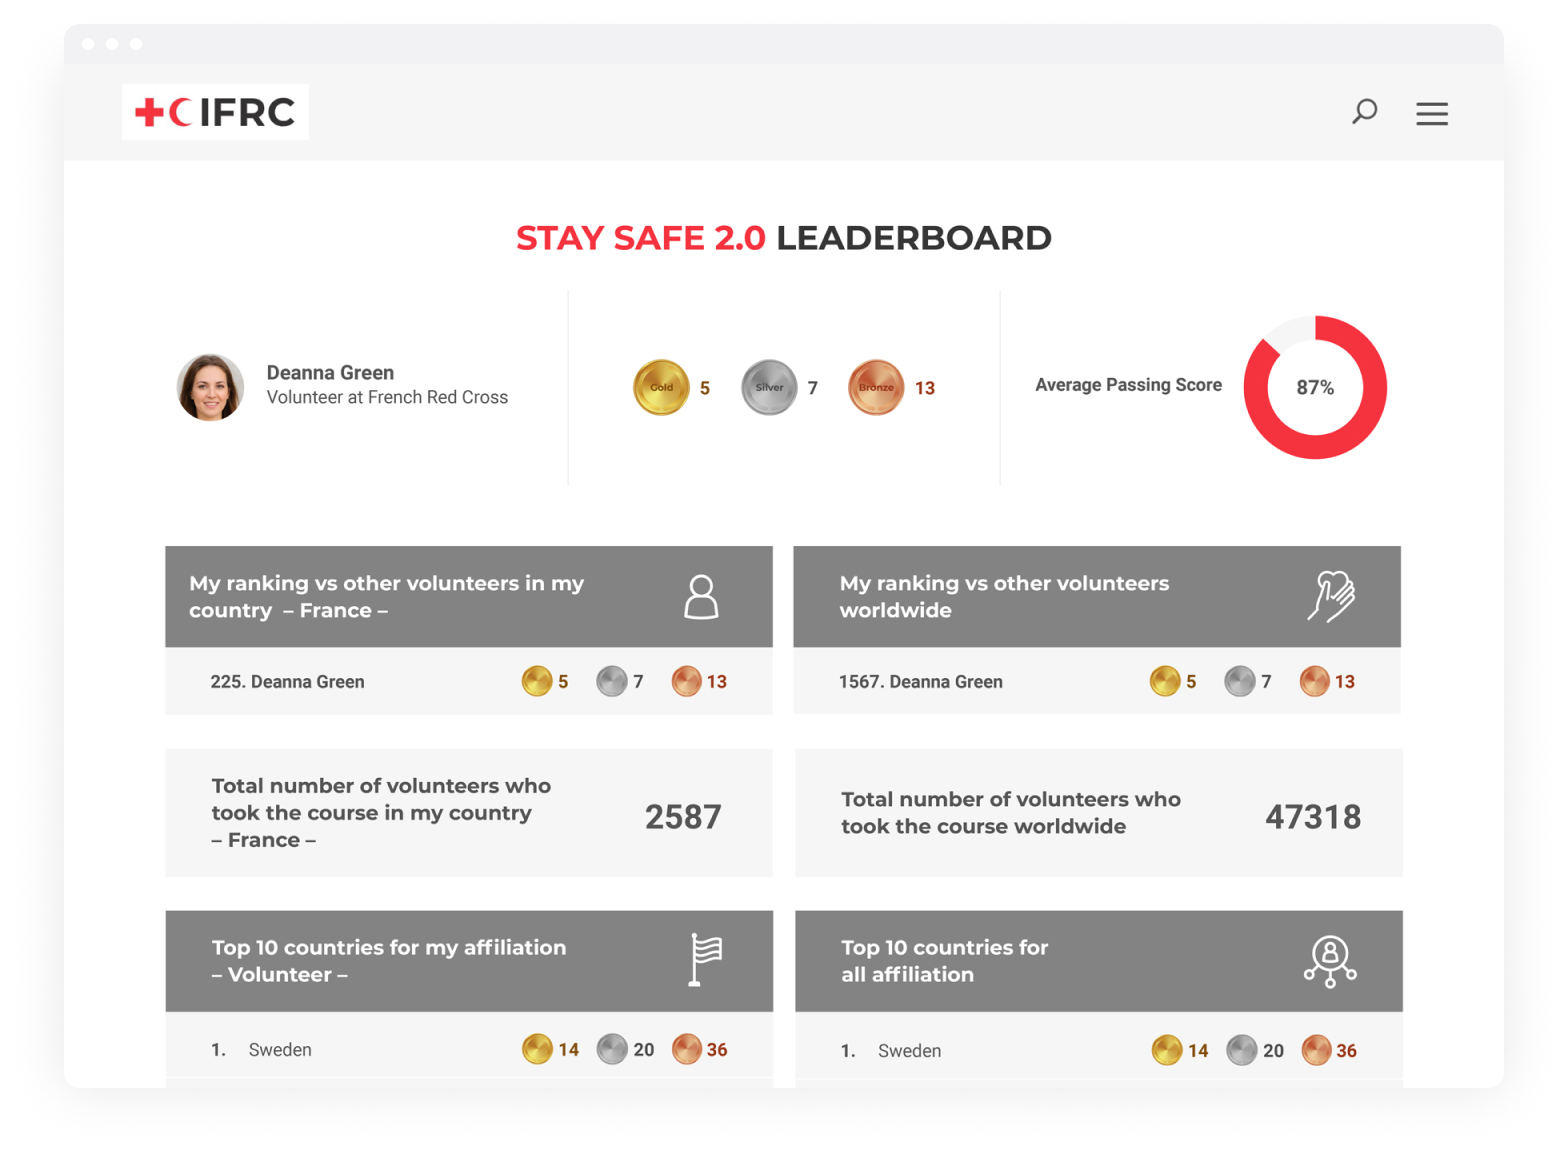
Engagement dashboards
Make performance and progress visible across teams
Leaderboards and progress tracking
Create friendly competition and motivate improvement
Real-time team insights
Give managers a live view of how their teams are doing
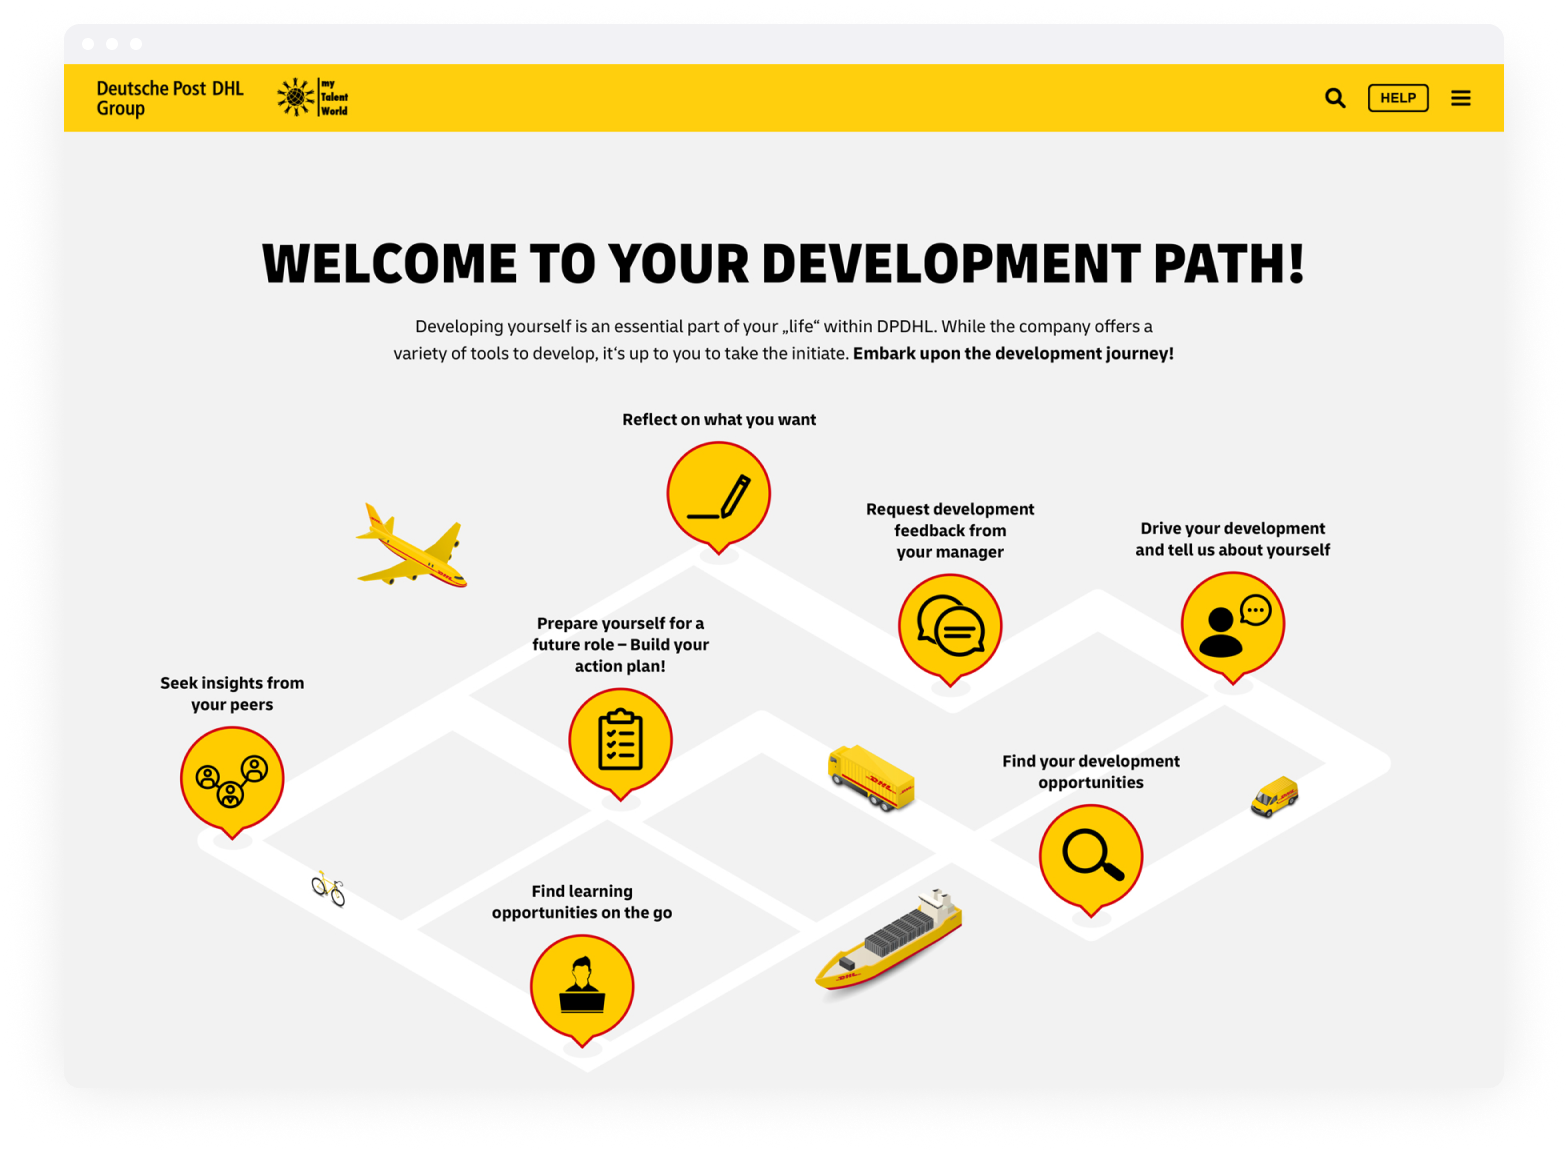
See it in action
Use your data across every part of your HR strategy
From performance to learning and engagement, use your analytics dashboards to see how things are performing, improve outcomes, and move faster as a team.
Performance and team progress
See how individuals and teams are performing and where support is needed
Learning and skills development
Track progress, identify skill gaps, and support continuous learning
Employee engagement
Understand how teams are doing and where engagement needs attention
Compliance and training
Stay on top of completion rates and regulatory requirements
Recruitment and hiring insights
Track hiring performance and improve your recruitment approach
Workforce trends and planning
Spot patterns early and plan ahead with confidence

Connect your data across your entire ecosystem
octo.taxi
Bring insights together from different platforms and make them work as one. Connect your HR systems, learning platforms, and external tools so your analytics are no longer limited to a single environment.
Go beyond standard platform boundaries and build your own dashboards that combine everything in one place.

Get Started
How it Works
Getting your analytics set up shouldn't be complicated. Our process is simple, collaborative, and shaped around your setup. From first conversation to final launch, everything is designed to fit how your organization works.
Discovery and Proposal
Let's kick it off with a conversation and a deep dive into your goals. We'll then prepare a tailored proposal and initial design concepts.
Design and Create
We'll design and build your project, integrating the custom elements into your platform to ensure a smooth and cohesive experience.
Review and Launch
Once you've reviewed and approved the final implementation, your project will go live, with ongoing support to ensure success.
Questions that usually come up
Frequently Asked Questions
Ready to turn HR data into better decisions?
Make your data work harder
Explore tailor-made analytics and reporting that help you focus on what counts and move forward with confidence.

“The collaboration was effortless and the end result exactly to our specifications. The attention to detail and their enthusiasm was refreshing.”
Belinda Hodgkinson
Head of Learning Infrastructure
Grant Thornton
Welcome Page Template
products.welcomePageTemplate.hero.description
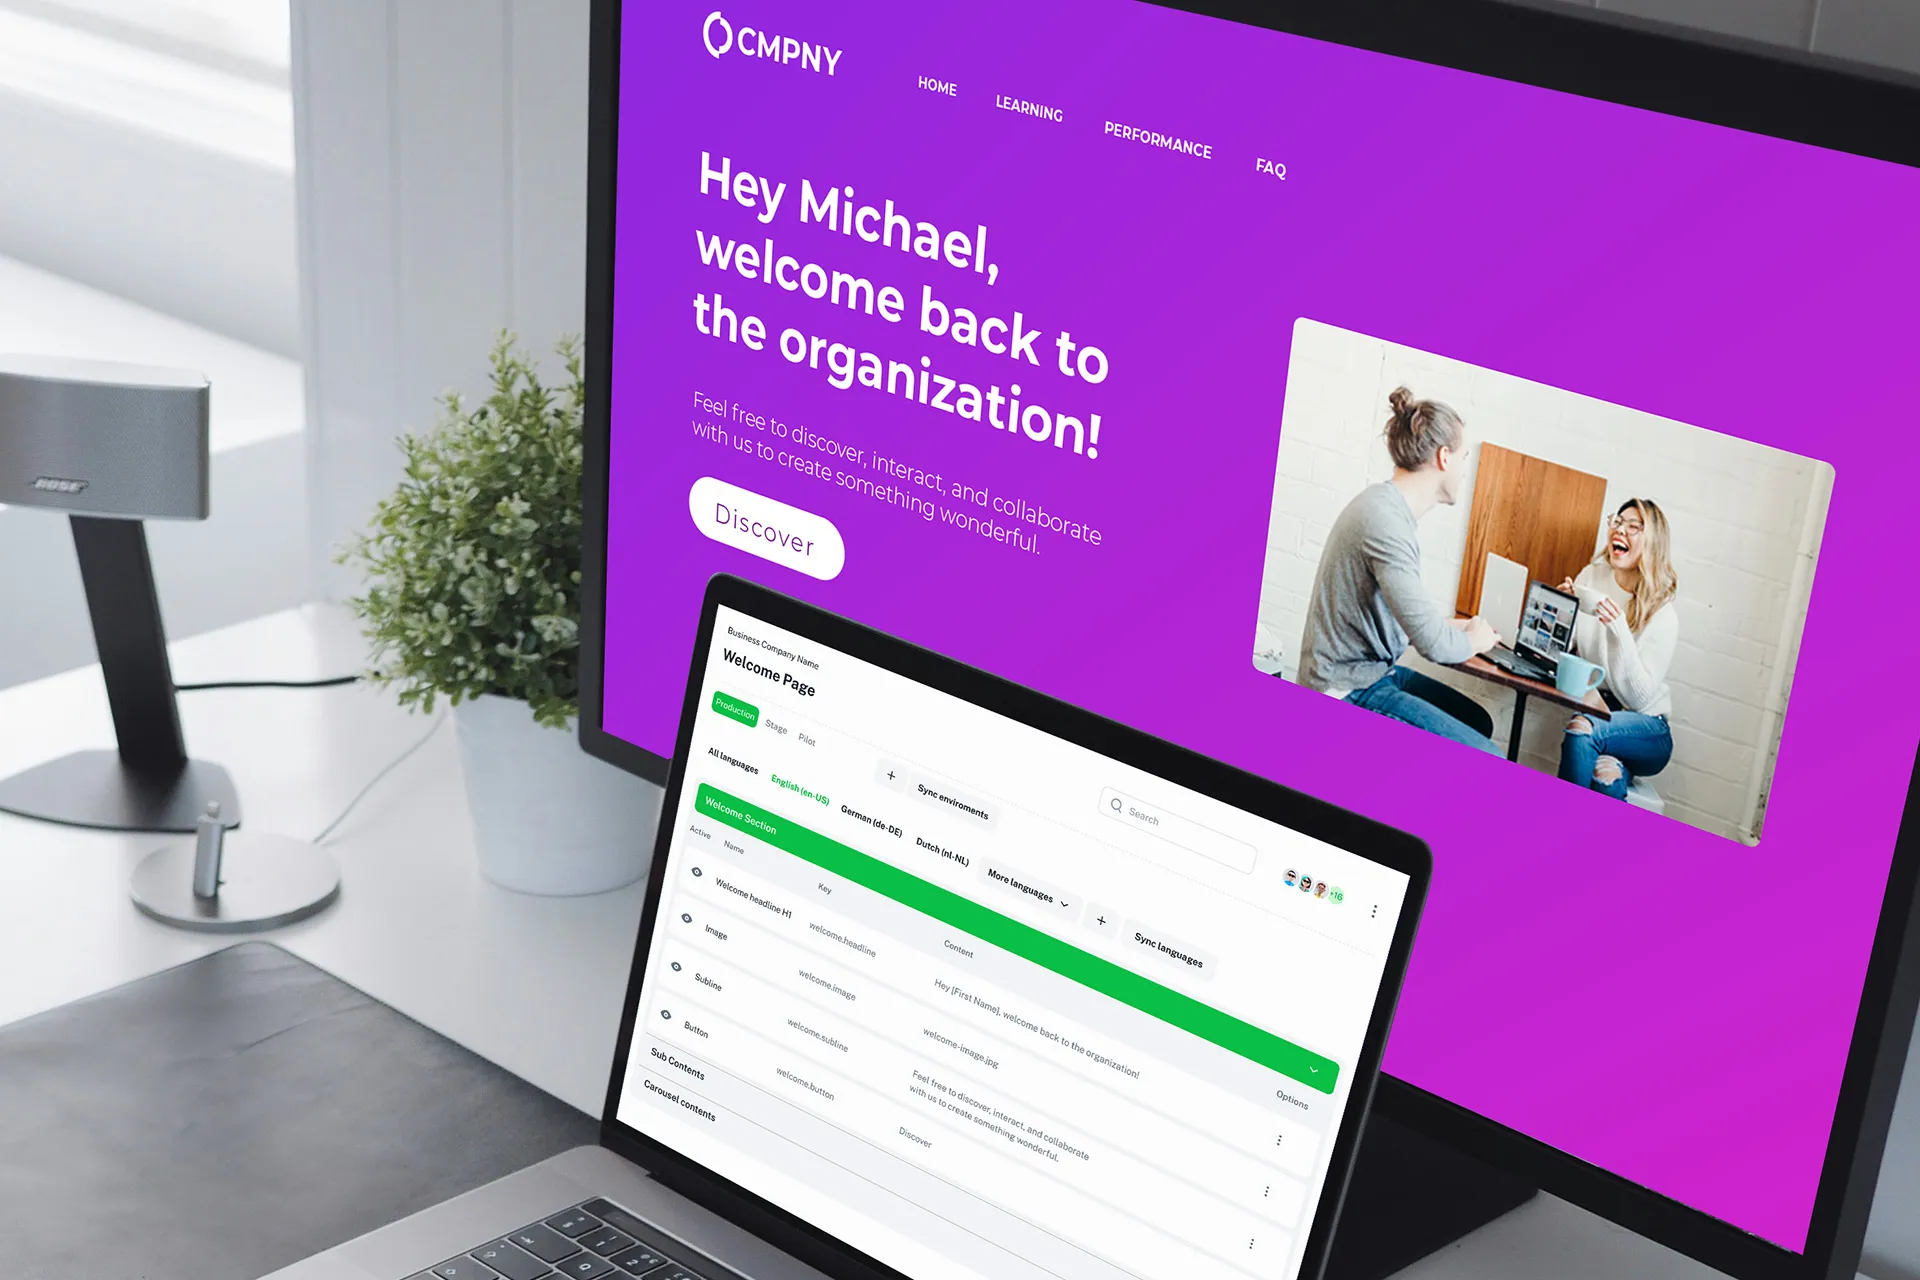
Octily Content Editor (OCE)
products.oce.hero.description

Compliance
Navigating compliance can be overwhelming, but it doesn’t have to be. We turn complex regulatory requirements into simple, streamlined processes. Whether you’re using CSX, Saba Cloud, or EdCast, our tailored solutions ensure your compliance journey is smooth and efficient.

The Business Case Your Cornerstone Customization Is Missing
A post about software sales got me thinking about our own pitch – and about why great Cornerstone customization so often stalls one level below the people who sign off the budget. Here is how to tell the third story: the one a CFO actually funds.